New publication: CBS

Comparing imports based on microdata with FIGARO

Working together with an inspiring team from the Dutch Central Bureau for Statistics (CBS), we were able to publish a report which compares imports based on microdata with FIGARO; the Full International and Global Accounts for Research in input-Output Analysis.

This dataset provides input and output data of industry and product characteristics, and supply and use data compared between countries.

In this project I was involved with the pseudonymisation of the original data, so it can be shared freely with (inter)national stakeholders.

The article describing this project can be found here, while the full .pdf report can be found here.

Successfully defended my PhD thesis!

Becoming a doctor

Last Wednesday, June 21, I had the honor to successfully defend my thesis! The title of my dissertation is

“Early-warning signals derived from actigraphy and electrocardiogram time series data: is it worth a transition in clinical practice?”

In my dissertation I describe our studies in which we investigated whether it is possible to anticipate transitions in depressive symptoms based on heart rate and movement data. My dissertation can be found here. The cover can be found here.

It was a great day. Thanks to Harriëtte Riese and Arie van Roon in particular for the excellent support and guidance during the past years. Thanks for the inspiring opposition for the relevant questions during the defence. And of course, thanks to all the wonderful colleagues, co-workers, and others for a great and inspirational journey! 

Afgelopen woensdag 21 juni heb ik de eer gehad om met succes mijn proefschrift te hebben verdedigd! De titel van mijn proefschrift is

“Early-warning signals derived from actigraphy and electrocardiogram time series data: is it worth a transition in clinical practice?”

In mijn proefschrift beschrijf ik onze studies waarin wij onderzocht hebben of het mogelijk is om transities in depressieve symptomen aan te kunnen zien komen op basis van hartslag- en bewegingsdata. Mijn proefschrift is hier terug te vinden . De omslag kan hier teruggevonden worden.

Het was een fantastische dag. Met dank aan Harriëtte Riese en Arie van Roon in het bijzonder voor de uitstekende ondersteuning en begeleiding in de afgelopen jaren. Bedankt voor de inspirerende oppositie voor de relevante vragen tijdens de verdediging. En natuurlijk alle geweldige collega’s, medewerkers, en anderen bedankt voor een geweldige en inspirerende reis!

Bits and pieces

First Flight and Oxygen on Mars

This week is an exciting one for those interested in exploration that goes beyond our blue planet.

Firstly, NASA was able to let a helicopter – called Ingenuity – fly on Mars [1]. An extraordinary performance, especially given that the Martian atmosphere is much thinner than the one on Earth, which makes flying the helicopter that much harder. Ingenuity’s maiden flight on Mars opens up the prospect of much easier, and quicker exploration of the Martian surface than would be possible with the brave Mars rovers, such as Curiosity and Opportunity. Yet, while it was indeed the first powered flight on another planet, it was not the first time a craft from Earth has flown on another planet, that honour goes to the Soviet Vega I and Vega II balloons which flew on Venus in 1985 [2, 3].

The second exciting event is that NASA’s Perseverance rover was the first to be able to produce oxygen on Mars [4]. Through a device called a MOXIE (Mars Oxygen In-Situ Resource Utilization Experiment), it is possible to convert some of Mars’ carbon-dioxide rich atmosphere into oxygen. Producing oxygen on Mars itself could drastically decrease the need to ship in oxygen from Earth, freeing scarce storage space on Mars-bound craft. It might also be one of the first foundational steps in (partially) terraforming Mars; making it suitable for Earth life.

Yet, such terraforming endeavours should always be well thought through; that is when oxygen was first introduced on Earth it was quite poisonous for almost all existing life; causing a mass extinction event, also called the Oxygen Catastrophe [5]. Let’s hope the future of space exploration is one of careful deliberation and cooperation, instead of rash decisions and international competition.

[1] https://mars.nasa.gov/technology/helicopter/#

[2] https://www.airspacemag.com/daily-planet/ireali-first-flight-another-world-180977540/?fbclid=IwAR0xGlnNWPqHRhIWz7vAjkTaT1_KiEgbn4kGl9PMVD9lNoDHEeXXChSP-bc

[3] https://nssdc.gsfc.nasa.gov/nmc/spacecraft/display.action?id=1984-128F

[4] https://www.nasa.gov/press-release/nasa-s-perseverance-mars-rover-extracts-first-oxygen-from-red-planet

[5] https://slate.com/technology/2014/07/the-great-oxygenation-event-the-earths-first-mass-extinction.html

Open Science 2020 Updates

Repositories & Open science awards

The year 2020 is flying past, perhaps even more so because of the differences and restrictions imposed by the COVID-19 situation.

Yet, this year has also yielded some remarkable results on the Open Science front. That is, the ESM Item Repository (www.esmitemrepository.com) celebrated its 1st year anniversary! From a simple but captivating hackathon idea to improve transparency of ESM items, to a working repository which was visited more than 5.300 times in its starting year. Moreover, thanks to many helpful and motivated item contributors we already collected more than 750 ESM items, while we hope to reach the 1000 ESM items mark soon. And we hope to be able to present our own blog in the near future!


Additionally, another interesting Open Science initiative was presented by the University of Groningen Library (UB) and the Open Science Community Groningen (OSCG), in the form of the Open Research Award. This award is meant to highlight various ways in which science can be made more transparent or reproducible. Even more interestingly, the organizers have opted to draw the three winners for the prize through a modified lottery; thereby cleverly having us reflect on whether peer-reviewed ranking, commonly used in science, is an efficient way of distributing grants, and scholarship (read their blog here: https://openscience-groningen.nl/blog-open-research-award-celebrating-openness-and-randomness/).

Even more stunningly, the ESM Repository was one of the lucky winners of the draw! As such, we now have to opportunity to present our work during the online “Celebrating Openness” event on 22nd of October (see: https://www.rug.nl/library/open-research-award/). Feel free to join us and to learn more about Open Science during this amazing event!


Best wishes & stay healthy!

Yoram.

End of the Year 2019 Celebrations

Open Science, Interview, & Publication

Only a few days ago, we said farewell to 2019 and welcomed the new year. However, the end of 2019 was especially fruitful, as we were able to publish our article about our automated actigraphy software package for R in the Journal of Science and Medicine in Sport (click here for full-text).

Additionally, 2019 was the first year in which our research institiute – SHARE; Science in Healthy Aging and Healthcare – did not only awarded top-publication awards, but also a brand-new Open Science award, during the annual SHARE PhD day. While I readily applaud such endeavours to promote Open Science, this occasion had an extra golden edge, as I – next to my colleague Stefania Barzeva – was one of the two recipients of this award! Many thanks for SHARE to make this Open Science reward a reality!

Lastly, I was invited for a short but interesting interview with Johanna Pykko for the SHARE newsletter. As it is always fun to discuss and brainstorm about research ideas and academia, I really enjoyed it (click here for full-text). The University of Groningen also covered the Open Science award 2019 in a seperate blog post (you can read it here).

Well that’s it for this small update; best wishes for 2020 to you all!

Open Science Blogpost #1

Science; why the best is not yet good enough.

Lead author: Yoram K. Kunkels
Other contributors: ReproducibiliTea Groningen

This blogpost was published originally in the OSCG blog-series about open science (link). 

Science is currently our best way of acquiring knowledge. It is the continuing process that has brought us – amongst others – our understanding that the Earth revolves around the Sun, the Industrial Revolution, and modern Medicine, while surely in a few years, it will also bring us hoverboards.

Such successes would suggest that all is well, and that science is always on a certain path to bring us even bigger discoveries. However, it is not. 

The scientific enterprise is a rather awkward one; the systems and institutions wherein scientists work are anything but perfect. Indeed, beneath the facade of seemingly perpetual improvements is a reality mostly unknown to outsiders. A reality wherein negative results about newly developed medications are sometimes suppressed, causing patients to be exposed to life-threatening dangers [1]. A reality wherein scientific conclusions are cherry-picked to report only the most spectacular, eye-catching results while more critical ones are dismissed [2]. Yes, even a reality where outright fraud can pass science’s seemingly rigorous peer review quality-check system [3, 4].

Does this all mean then that science is incurable, that we should dismiss it altogether? Again, no it does not. Nor does it mean that scientists are all unscrupulous individuals who do not care about the quality of their work. On the contrary, most scientists are highly motivated about doing the right thing and they care about the topics they study and those involved. This means that science is currently the best we’ve got, but it is not yet good enough. Luckily, researchers – especially those at the start of their careers – are getting more and more aware of these issues and are finding each other to discuss possible solutions.

However, the reasons science is currently underperforming are complex and multifaceted, and will require dedicated attention and care from not only academics, but our broader society. To provide some insights on what is wrong and how to improve those points we have started a series on these meta-science (the science about doing science) topics. Some of the subjects we will discuss are:

  • What are the 10 most common misconceptions about Open Science? In her upcoming blog post, Dr. Jojanneke Bastiaansen explains such common misconceptions and possible solutions (link).
  • Code and algorithms are becoming increasingly important to conduct reproducible scientific studies; but who checks its’ quality? Dr. Rei Monden discusses these problems and offers intriguing solutions in her blog post (available early next year).
  • One perspective on how to improve science is by Dr. Maurits Masselink who argues that we should consider not doing science at all if we cannot do it well. (available early next year).

Some of the topics that we will address in future blog posts are: (1) why are scientists pressured to produce lots of low-quality research, (2) how can we leverage new technologies and methods to decrease the time pressure so commonly experienced by scientists, (3) Is science really transparent, and why is this necessary, (4) why some scientific results cannot be repeated, (5) Why are negative results not reported, (6) what happens when the science is sound, but communicating results goes wrong?

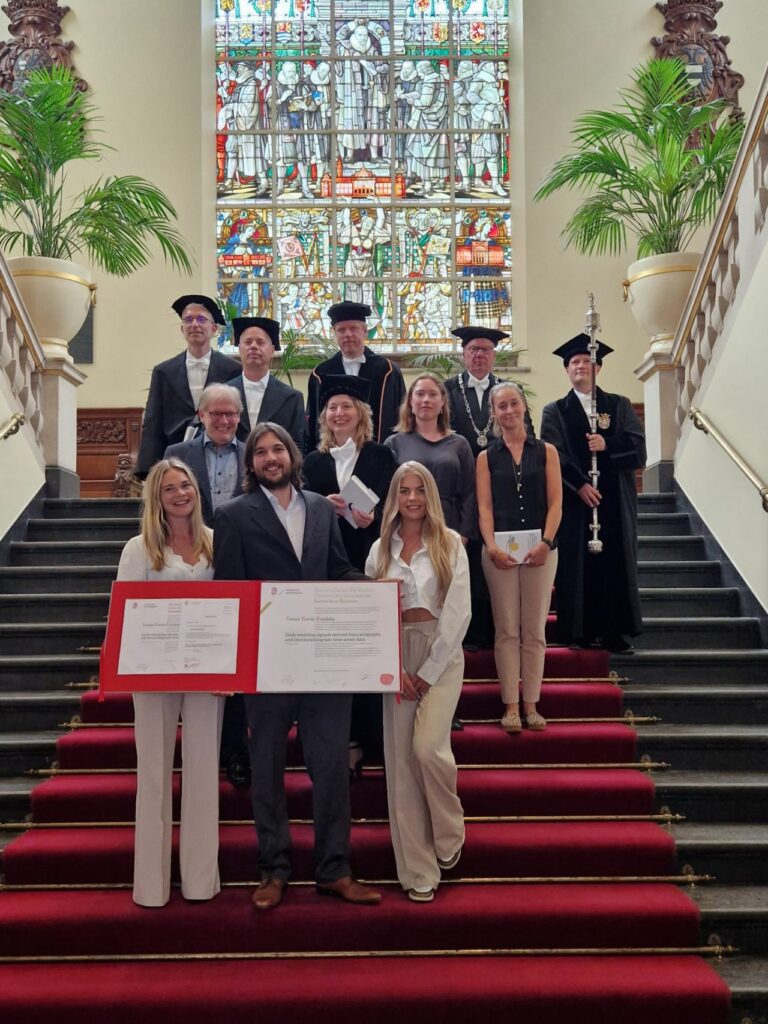
We are a group of motivated young researchers associated with the Open Science Community Groningen. We would love to share our perspectives on, and possible solutions for the current issues in science. 

Be sure to check in regularly, as we will routinely update our website with new, provoking, and interesting blog posts and articles. Are you already fired up to make a change in improving science? Come visit us at www.openscience-groningen.nl to learn more, or feel free to discuss these topics together at one of our bi-weekly ReproducibiliTea meetings https://osf.io/3qrj6/.

Best,

The ReproducibiliTea Groningen.


References

[1] McGoey, L., & Jackson, E. (2009). Seroxat and the suppression of clinical trial data: regulatory failure and the uses of legal ambiguity. Journal Of Medical Ethics, 35(2), 107-112. doi: 10.1136/jme.2008.025361 

[2] Goldacre, B. (2019). The dangers of cherry-picking evidence. Retrieved 24 September 2019, from https://www.theguardian.com/commentisfree/2011/sep/23/bad-science-ben-goldacre 

[3] Vogel, G. (2019). Report: Dutch ‘Lord of the Data’ Forged Dozens of Studies (UPDATE). Retrieved 24 September 2019, from https://www.sciencemag.org/news/2011/10/report-dutch-lord-data-forged-dozens-studies-update 

[4] van Kolfschooten, F. (2019). Social psychologist relinquishes chair after data manipulation charges. Retrieved 24 September 2019, from https://www.sciencemag.org/news/2015/04/social-psychologist-relinquishes-chair-after-data-manipulation-charges

Buyers Guide: Heart rate monitors

Points to consider

In a previous buyers guide, we have looked at some important points to consider when choosing a suitable actigraph for scientific research.

Today, however, we will focus on another substantial player in the wearable field, namely the ambulatory heart rate monitor

As traditional heart rate (HR) monitors are quite bulky and often feature many cables, they are not very suitable for measuring patients in their daily life settings. Hence, measurements taken with such devices often lack ecological validity (although their complexity does potentially offer better data quality; good enough for cardiologists to diagnose all but the most outlandish cardiac arrhythmias).

Ambulatory heart rate monitors sacrifice some of the detail of hospital-grade HR devices for to make them wearable under daily life settings. Thus facilitating the development of early warning systems for cardiac problems, or ambulatory collection of heart rate data.

If you are looking to use such mobile heart rate monitor in your own study, the following points might be worthwile to consider:

Same goal, different solutions

First things first, while your goal might be to simple measure HR, or perhaps more precisely, to collect series of Interbeat-Intervals (IBI’s), there are multiple ways to do so.  

Two common methods are Electrocardiography (ECG), and Photoplethysmography (PPG). In short, ECG measures the electrical activity of the heart, while PPG optically measures blood volume change. Both can be used to derive HR and IBI series, but do so in a different manner, which can have important consequences for your study.

Example of an ambulatory ECG monitor (the Cortrium C3).

Example of an ambulatory PPG monitor (the Ithelete finger sensor).

Moreover the data obtained with both device look very different. As ECG is based on electrical pulses, its signal shows very sharp and distinct r-peaks. As PPG measures blood volume change, its data shows much broader peaks. Also, because PPG is often measured at the extremities (fingers, earlobes), there is often a delay before the pulse is registered when compared to whose electrical signal travels much faster. 

ECG signal obtained with the Cortrium C3.

PPG signal obtained with the Ithlete finger sensor.

Better user comfort, better results

Depending on the design of your study, the time participants have to wear the HR monitor will differ. Some will opt for continuous 24 hour measurements, while others might want to measure participants for longer periods of time, possibly months.

While short term continuous measurements are very feasible and common, long term continuous measurements are often not feasible, for a number of reasons. For example, ECG measurements require the HR monitor to be attached to the chest of the participant with electrodes. The glue of these electrodes will cause skin irritations when used over longer periods of time, causing low participant compliance.

Skin irritation caused by ECG electrodes. 

ESM Item Repository

Improving Transparency in Science: ESM Item Repository

ESM stands for Ecological Sampling Method – think of it as a tool for following the development of your mood over the day. Such as filling in a mood diary 5 times a day, but then on your smartphone. ESM is currently enjoying clinical and academic interest as it enables users to monitor mood intensively in an ecological valid environment.

However, the current infrastructure for systematically categorising and storing ESM questions – or items – is a hot mess; because there is no such infrastructure in place yet!

As you could imagine, having a plethora of scientists around the world creating, translating, and editing ESM items without proper infrastructure will hinder transparency and reproducibility. Especially as a clear overview of these items, their history of use and edits, is not systematically documented anywhere.

Hence, an inspiring team of researchers from the KU Leuven, and myself, have started the ESM Item Repository – an online database for ESM items.

ESM items can be easily accessed through an online portal. If you want to find out more, or perhaps even help adding items to the repository, check out our OSF page! More interested in the code? Check out our accompanying Github page here.

ACTman: Automatic Event marker to Sleep log Functionality

Expanding ACTman's possibilities

Hi guys, I am excited to present to you here, our newest update for our ACTman package!

As you might know, we introduced the ACTman software for R as a useful tool for both preprocessing as well as analysis of actigraphy data. Hopefully ACTman will facilitate easier, quicker, and better reproducible actigraphy analyses.

A new piece of functionality we just added – and which I am very enthousiastic about – is the possibility to read in event marker files and automatically convert them to sleep logs within mere seconds!

This is an especially handy tool for those researchers who use the marker button to estimate the times of going to bed and getting out of bed. Instead of manually writting these times down, participants can just simply press the event marker.

And instead of having to manually transcribe the event marker times to a generic sleeplog, you can now have ACTman do it for you in a quick and reproducible manner!

And the best part is that you don’t have to do anything special for it. 

If you are using the MotionWatch 8, and ACTman detects no sleeplog in your working directory but does detect a marker file, it will automatically transform it to a sleeplog for you.

You also get user control over some decisions. For example, if marker buttons are missing, ACTman offers you the choice to fill them in yourself, fill in the missing value with a mean value, or to abort the analysis.

Furthermore, ACTman automatically removes any other marker between the first and lst mrker press of that day. Multiple false presses are thus no problem for ACTman.

Interested? Check ACTman out for yourself by clicking here!

Period / Frequency Converter in R

A simple but handy tool

For some time I have been delving deeper into the interesting world of Spectral Analyses.

So far I have been delighted, as this is one of those academic techniques that is broadly applicable, and can teach you a lot about various topics.

I started using spectral analyses in the context of cardiology. However, as I learn more about it, it also teached me about music theory, higher harmonics, and color spectra. Just awesome how such differing topics can be closely linked!

However, I am rambling a bit. What I wanted to give you is this; a Period / Frequency Converter in R. When I first learned about spectral analyses I struggled a bit with the frequency and period units.  As such, I programmed this little tool to easily convert periods to frequencies and back again. Feel free to try and use it! You can find it on my Github page: